Visualization Update: Download Charts as Images
What’s New
You can now download visualization charts as images directly from the platform. This addition makes it easier to include charts in reports, presentations, and other review materials without taking screenshots.
Image Export Limits
Each downloaded image supports a maximum of 15 values on the X-axis and 15 values on the Y-axis. This limit helps keep charts readable and avoids oversized images or the need to split a chart across multiple images.
How This Helps Reviewers
Simplifies reporting: Add downloaded charts to reports and slide decks to support your findings.
Makes sharing easier: Share a visual summary with colleagues, clients, or other stakeholders.
Reduces manual effort: Download the chart directly instead of capturing and cropping screenshots.
Supports readability: Keep exported charts manageable and suitable for use in documents and presentations.
How to Use
Open the visualization chart you want to download.
Select the image download option.
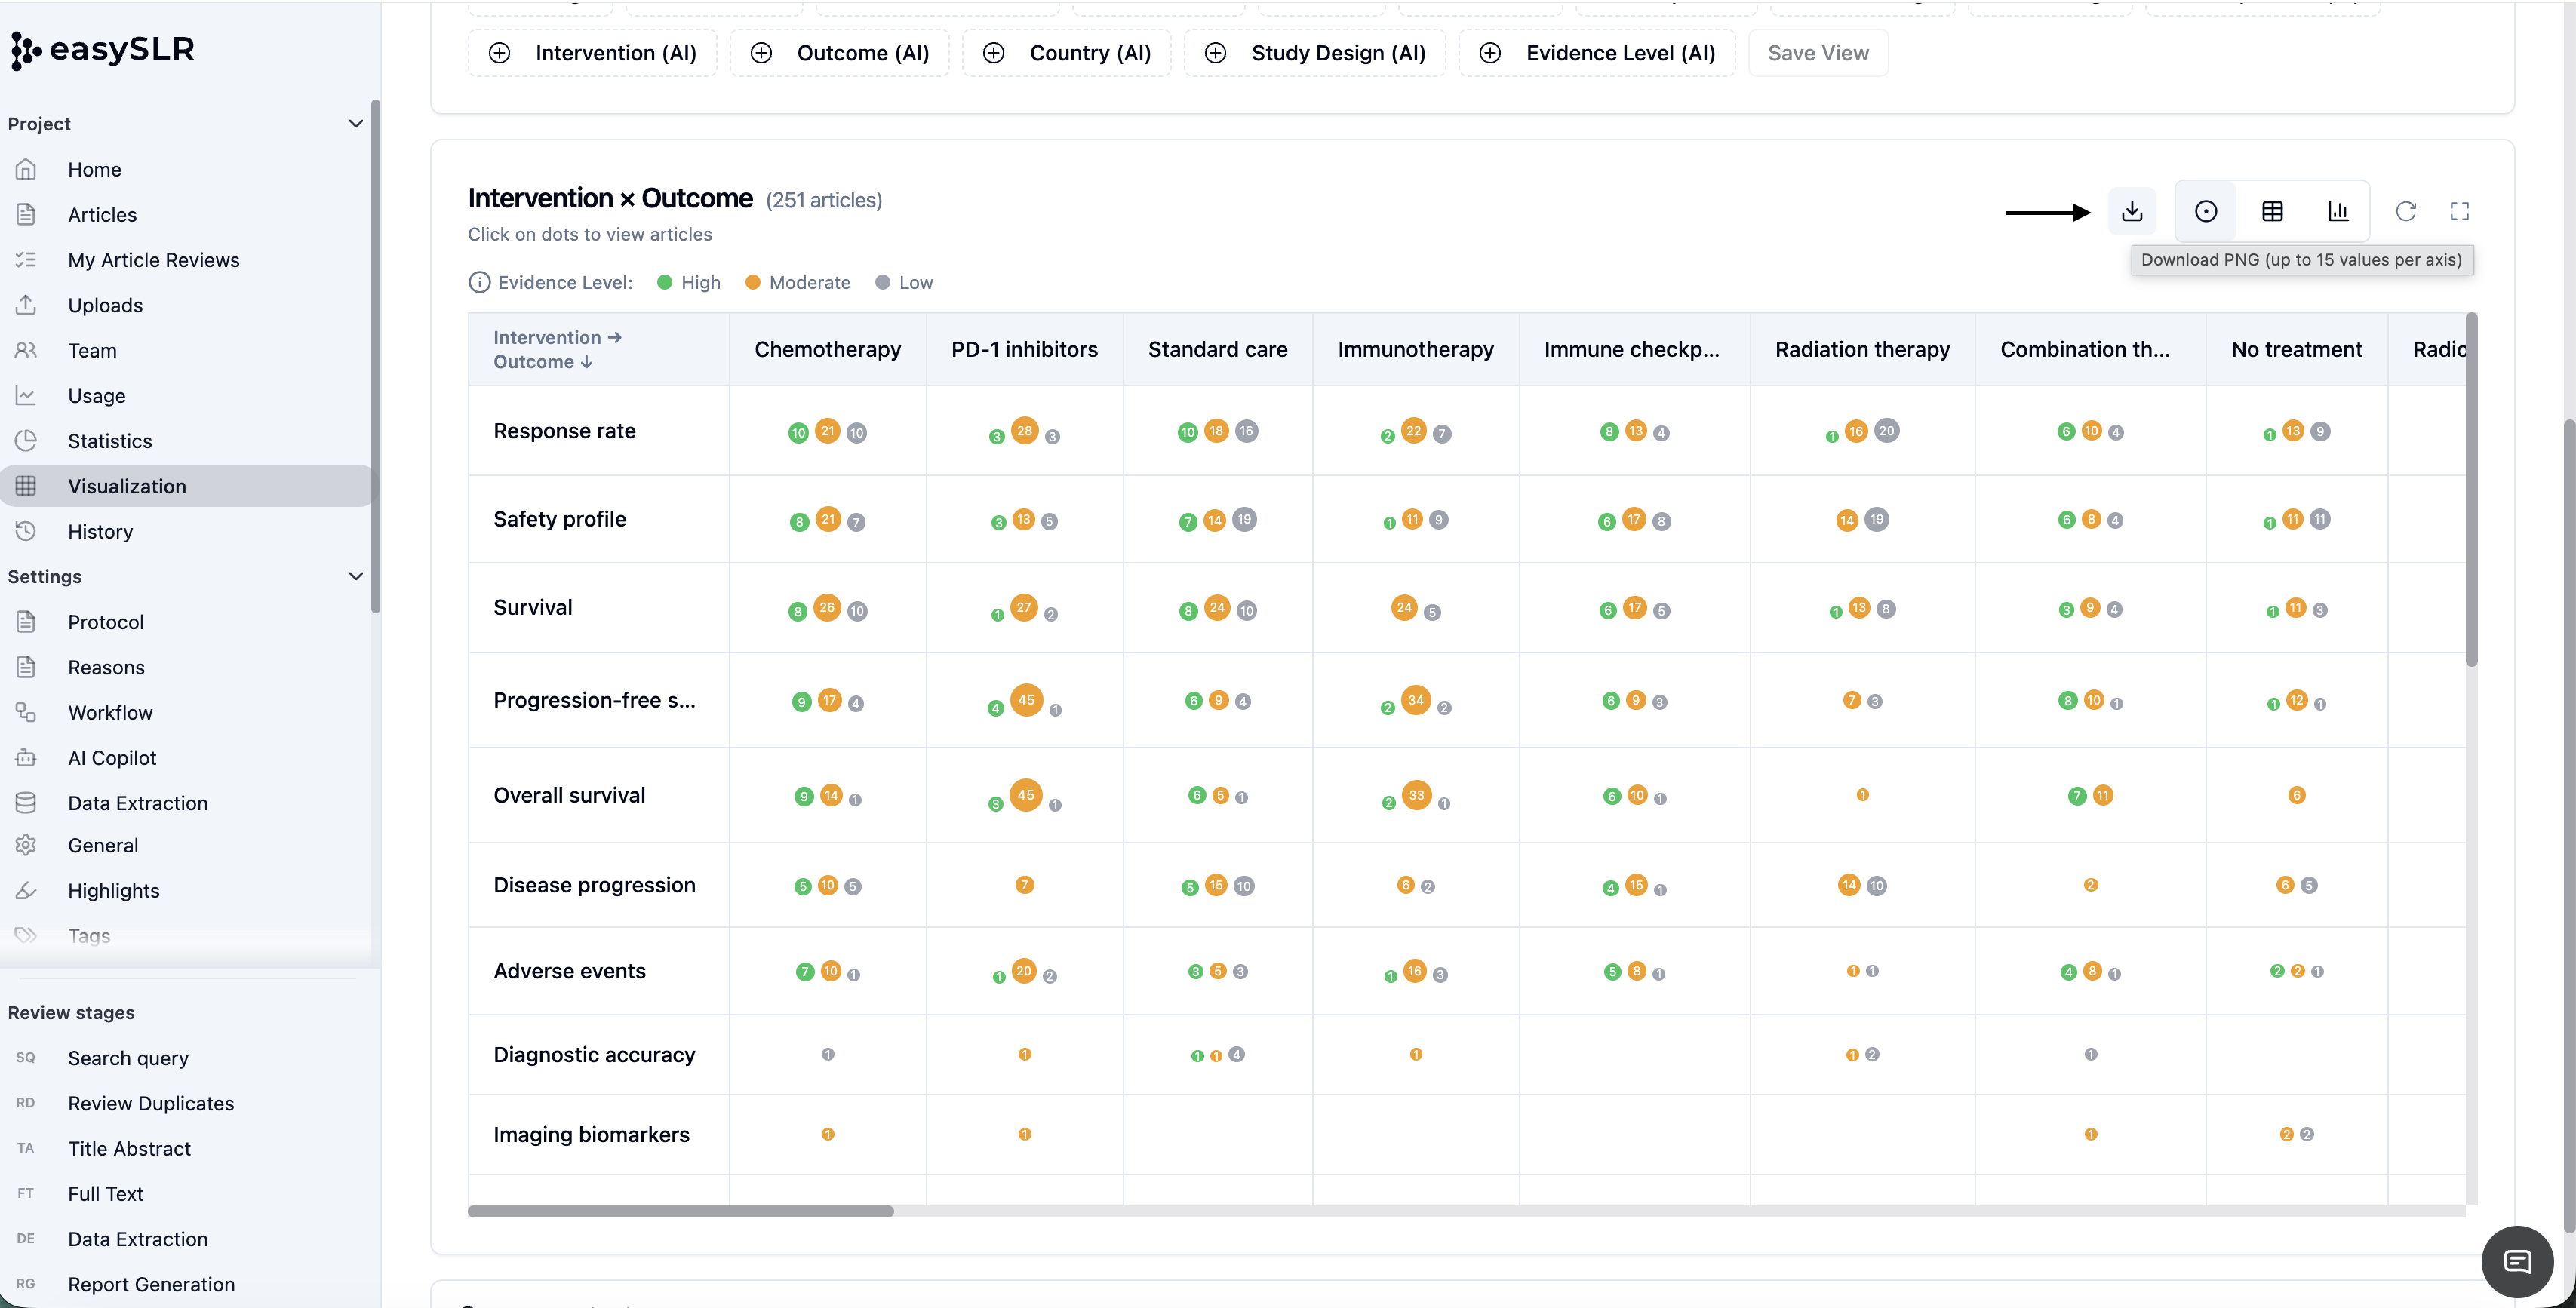
Use the downloaded image in your report, presentation, or other materials.