Table & Graph Digitiser within the PDF Viewer
EasySLR now supports an integrated Table and Graph Digitiser within the PDF viewer, enabling users to extract and utilise data directly from tables and figures.
Overview
Extracting data from tables and graphs in research papers is often time-consuming—especially when dealing with image-based content.
With this update, users can digitise tabular and graphical data directly within the PDF interface, review the extracted values, and add them to the data extraction form.
What’s New
1. In-PDF Table Extraction
Detect and extract data from tables within PDFs
Converts tables into editable, structured formats
2. Graph Digitisation
Extract numerical values from graphs and charts
Supports:
Line graphs
Bar charts
Scatter plots
Enables capture of multiple data points for analysis
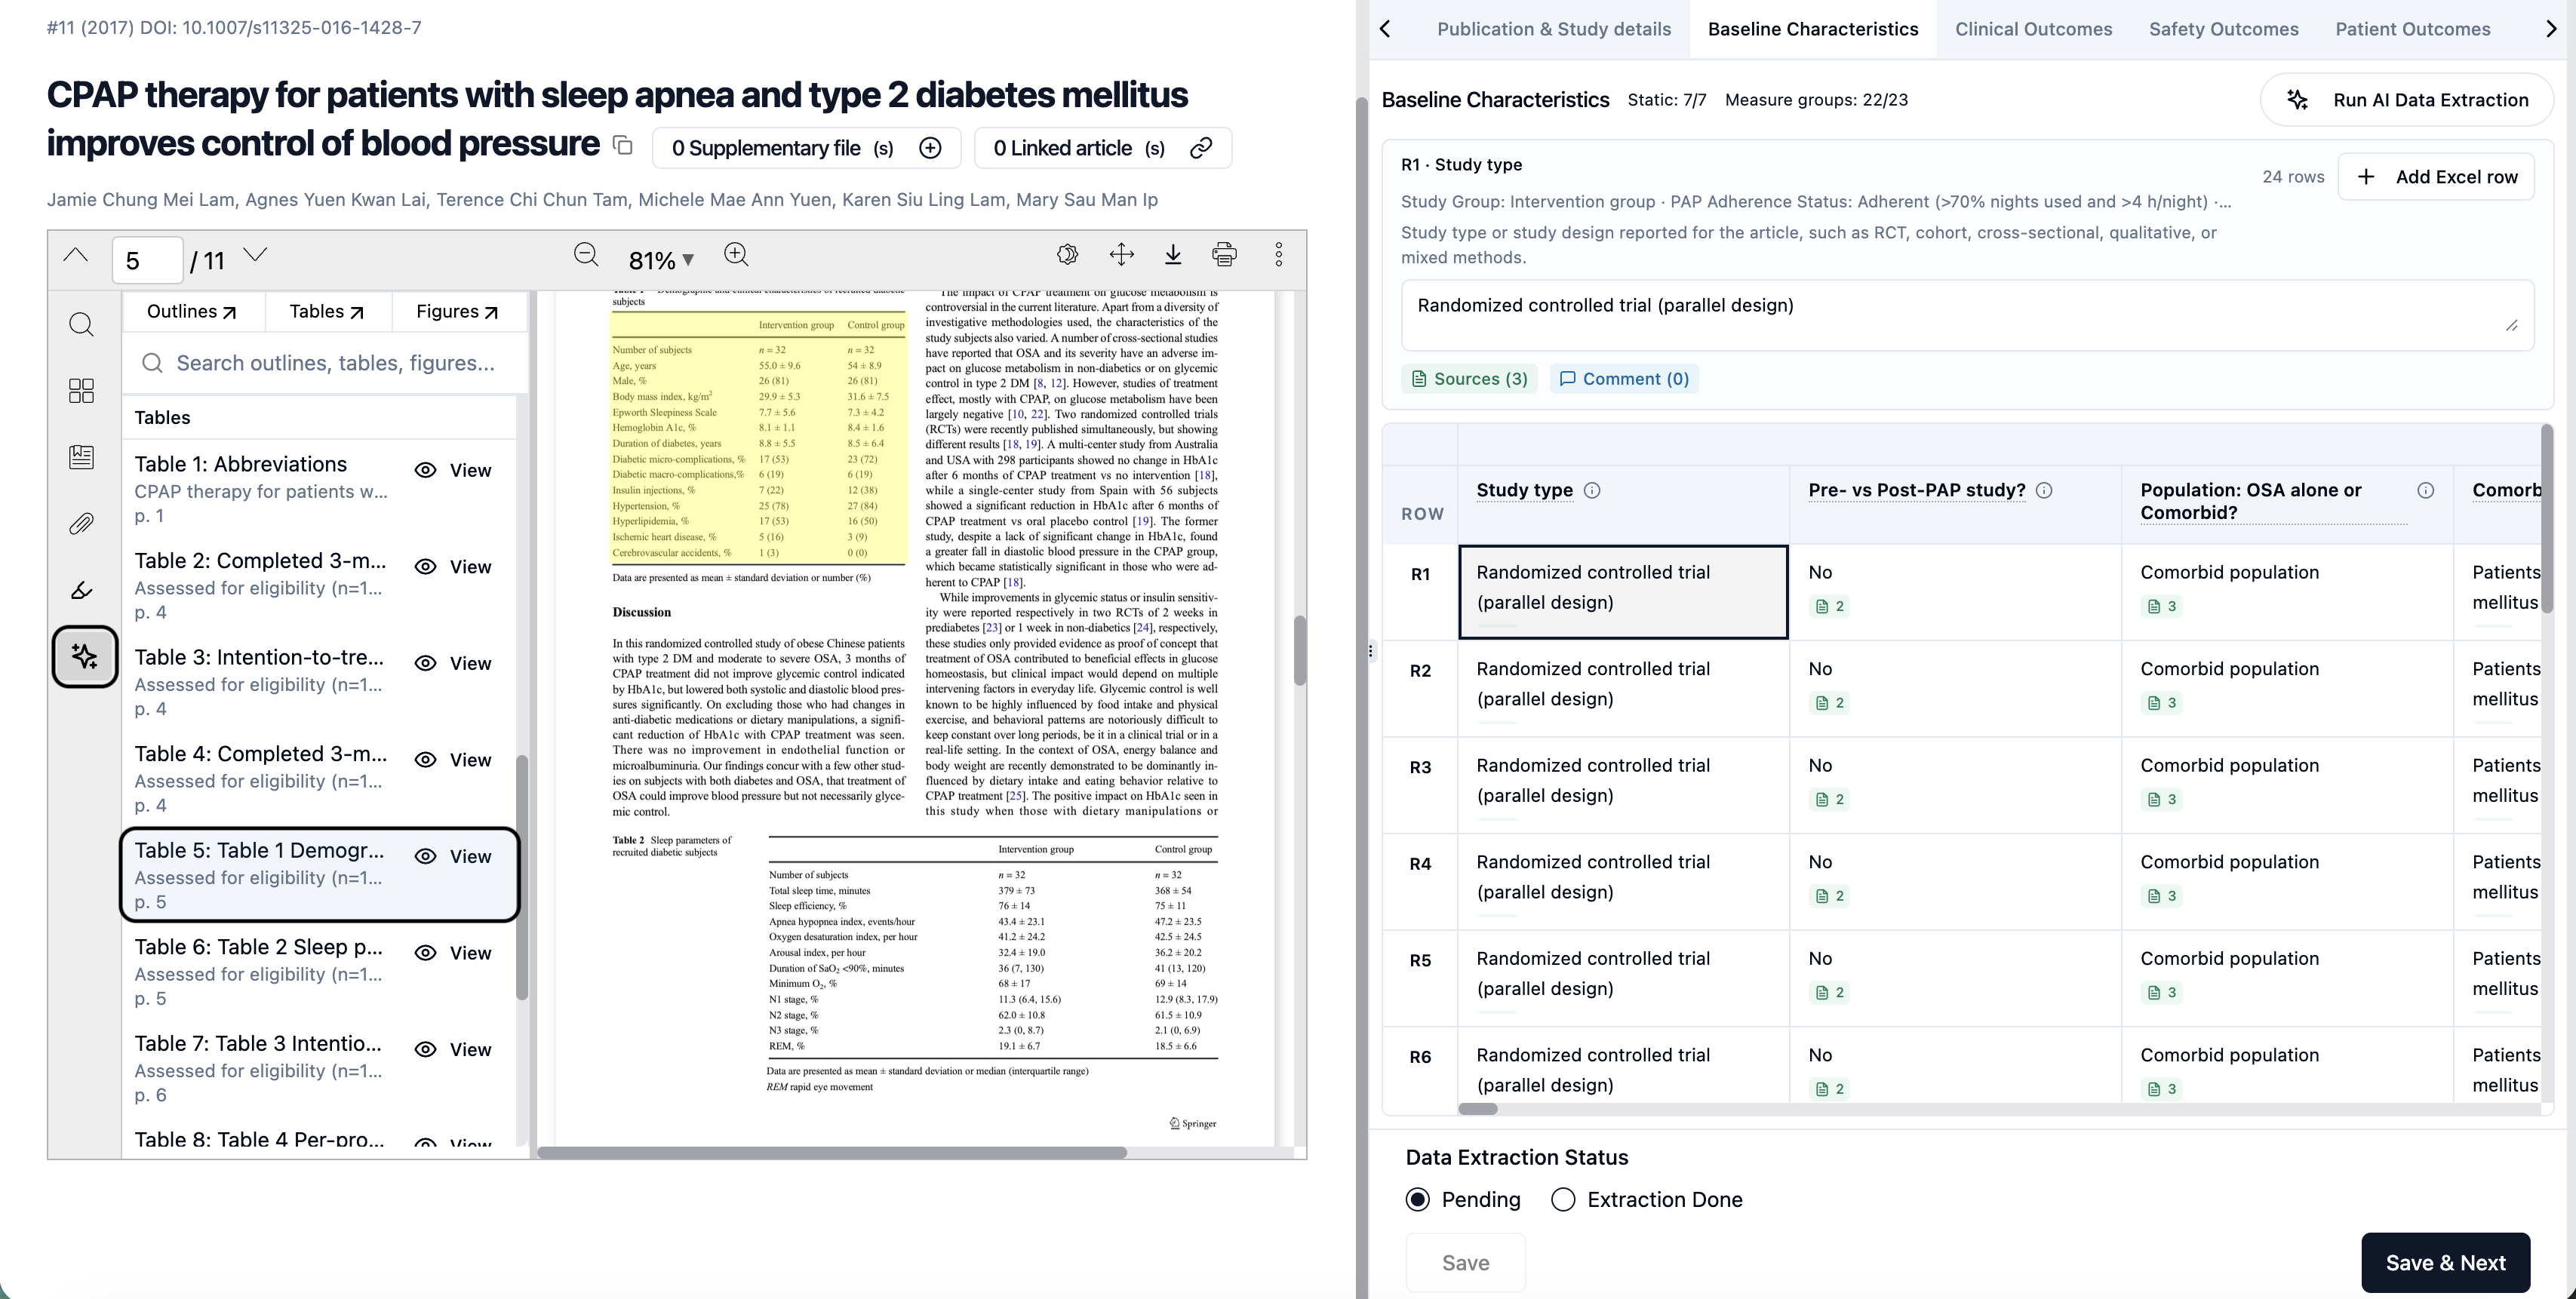
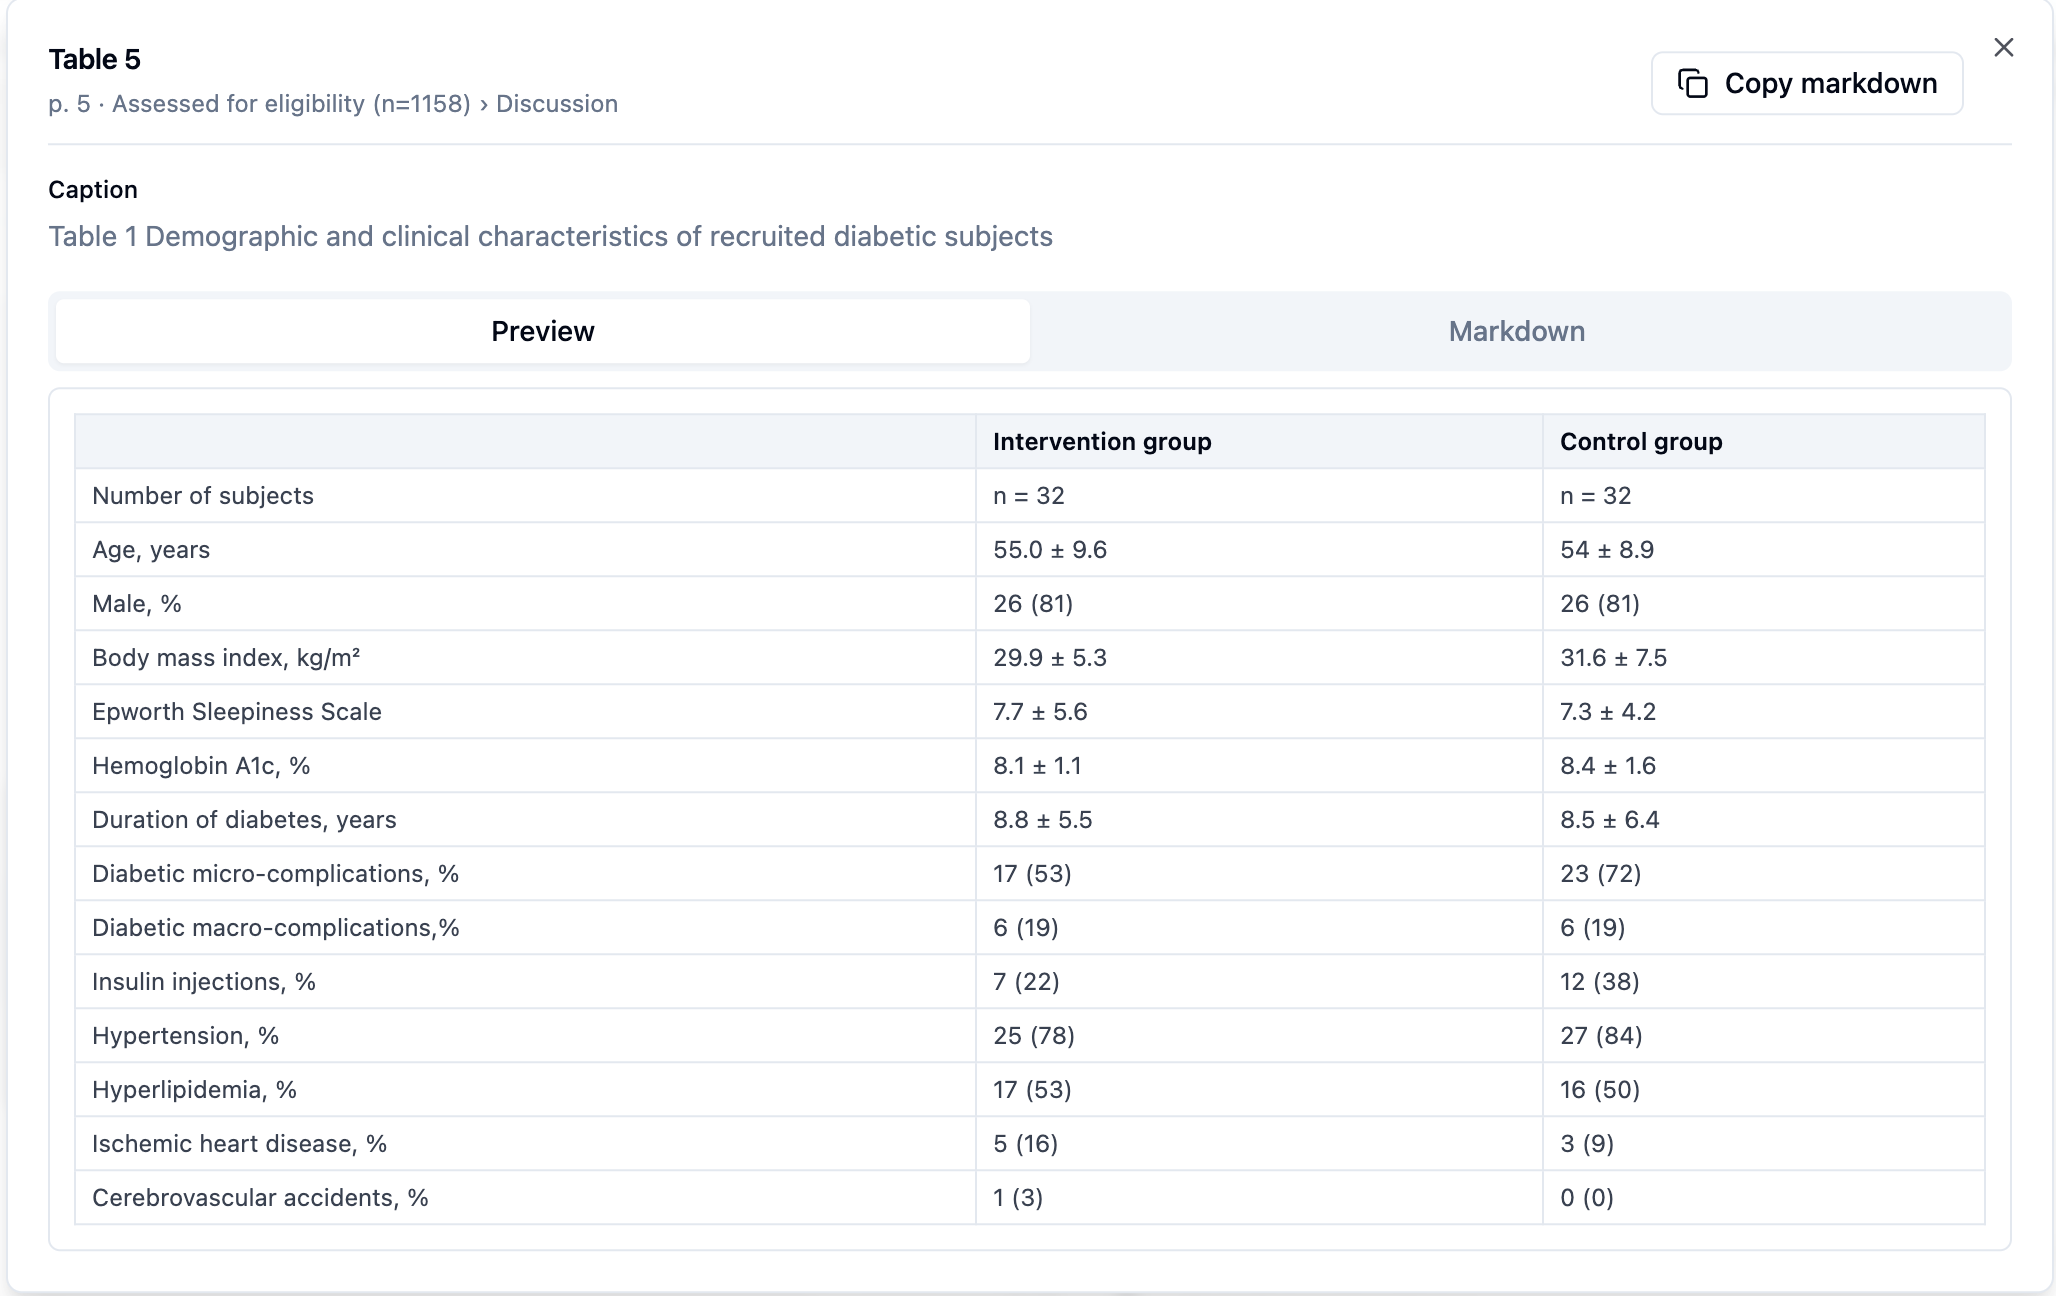
3. “View” Extracted Values
After AI run, users can click on the PDF outline, click “View” to see all the values
Displays structured data in an easy-to-review format
How It Works
Open the PDF in EasySLR
Click on the PDF outline
Select the Table or Graph
Click “View” to access the data
Add relevant values directly to the data extraction window
Why This Matters
This enhancement helps teams:
Extract complex data faster and more accurately
Reduce manual effort and errors
Seamlessly move from data capture to structured extraction
Improve efficiency in meta-analysis workflows
Important Notes
Manual validation is recommended for accuracy
Results may vary based on PDF quality and resolution
Users retain full control to edit and verify extracted data
Summary
With the Table & Graph Digitiser within the PDF viewer, EasySLR enables you to:
Extract data directly from visual content
Review values instantly using the “View” option
Add data seamlessly into the extraction workflow