Free Plot Digitizer in EasySLR
Overview
The Plot Digitizer in EasySLR enables researchers to extract numerical data from graphs and charts contained within scientific publications. Instead of manually estimating values from visual plots, the tool converts graphical information into structured, reusable data that can be reviewed, copied, and incorporated into your evidence synthesis workflow.
This feature is particularly useful when numerical values are presented only as figures and are not available in tables or the main text of the publication.
Why Use the Plot Digitizer?
Many research articles present important outcomes only as graphs, making manual data extraction both time-consuming and prone to error.
The Plot Digitizer helps researchers:
Capture data from published figures more efficiently.
Reduce manual transcription effort.
Improve consistency during data extraction.
Validate graphical results more easily.
Reuse extracted values for downstream analysis.
Supported Plot Types
The Plot Digitizer supports a variety of commonly used scientific figures, including:
Line graphs
Scatter plots
Bar charts
Column charts
Time-series plots
Multi-series graphs
KM-Curve
How to Access the Plot Digitizer
Navigate to easyslr.com.
Click Tools.
Select the Plot Digitizer option.
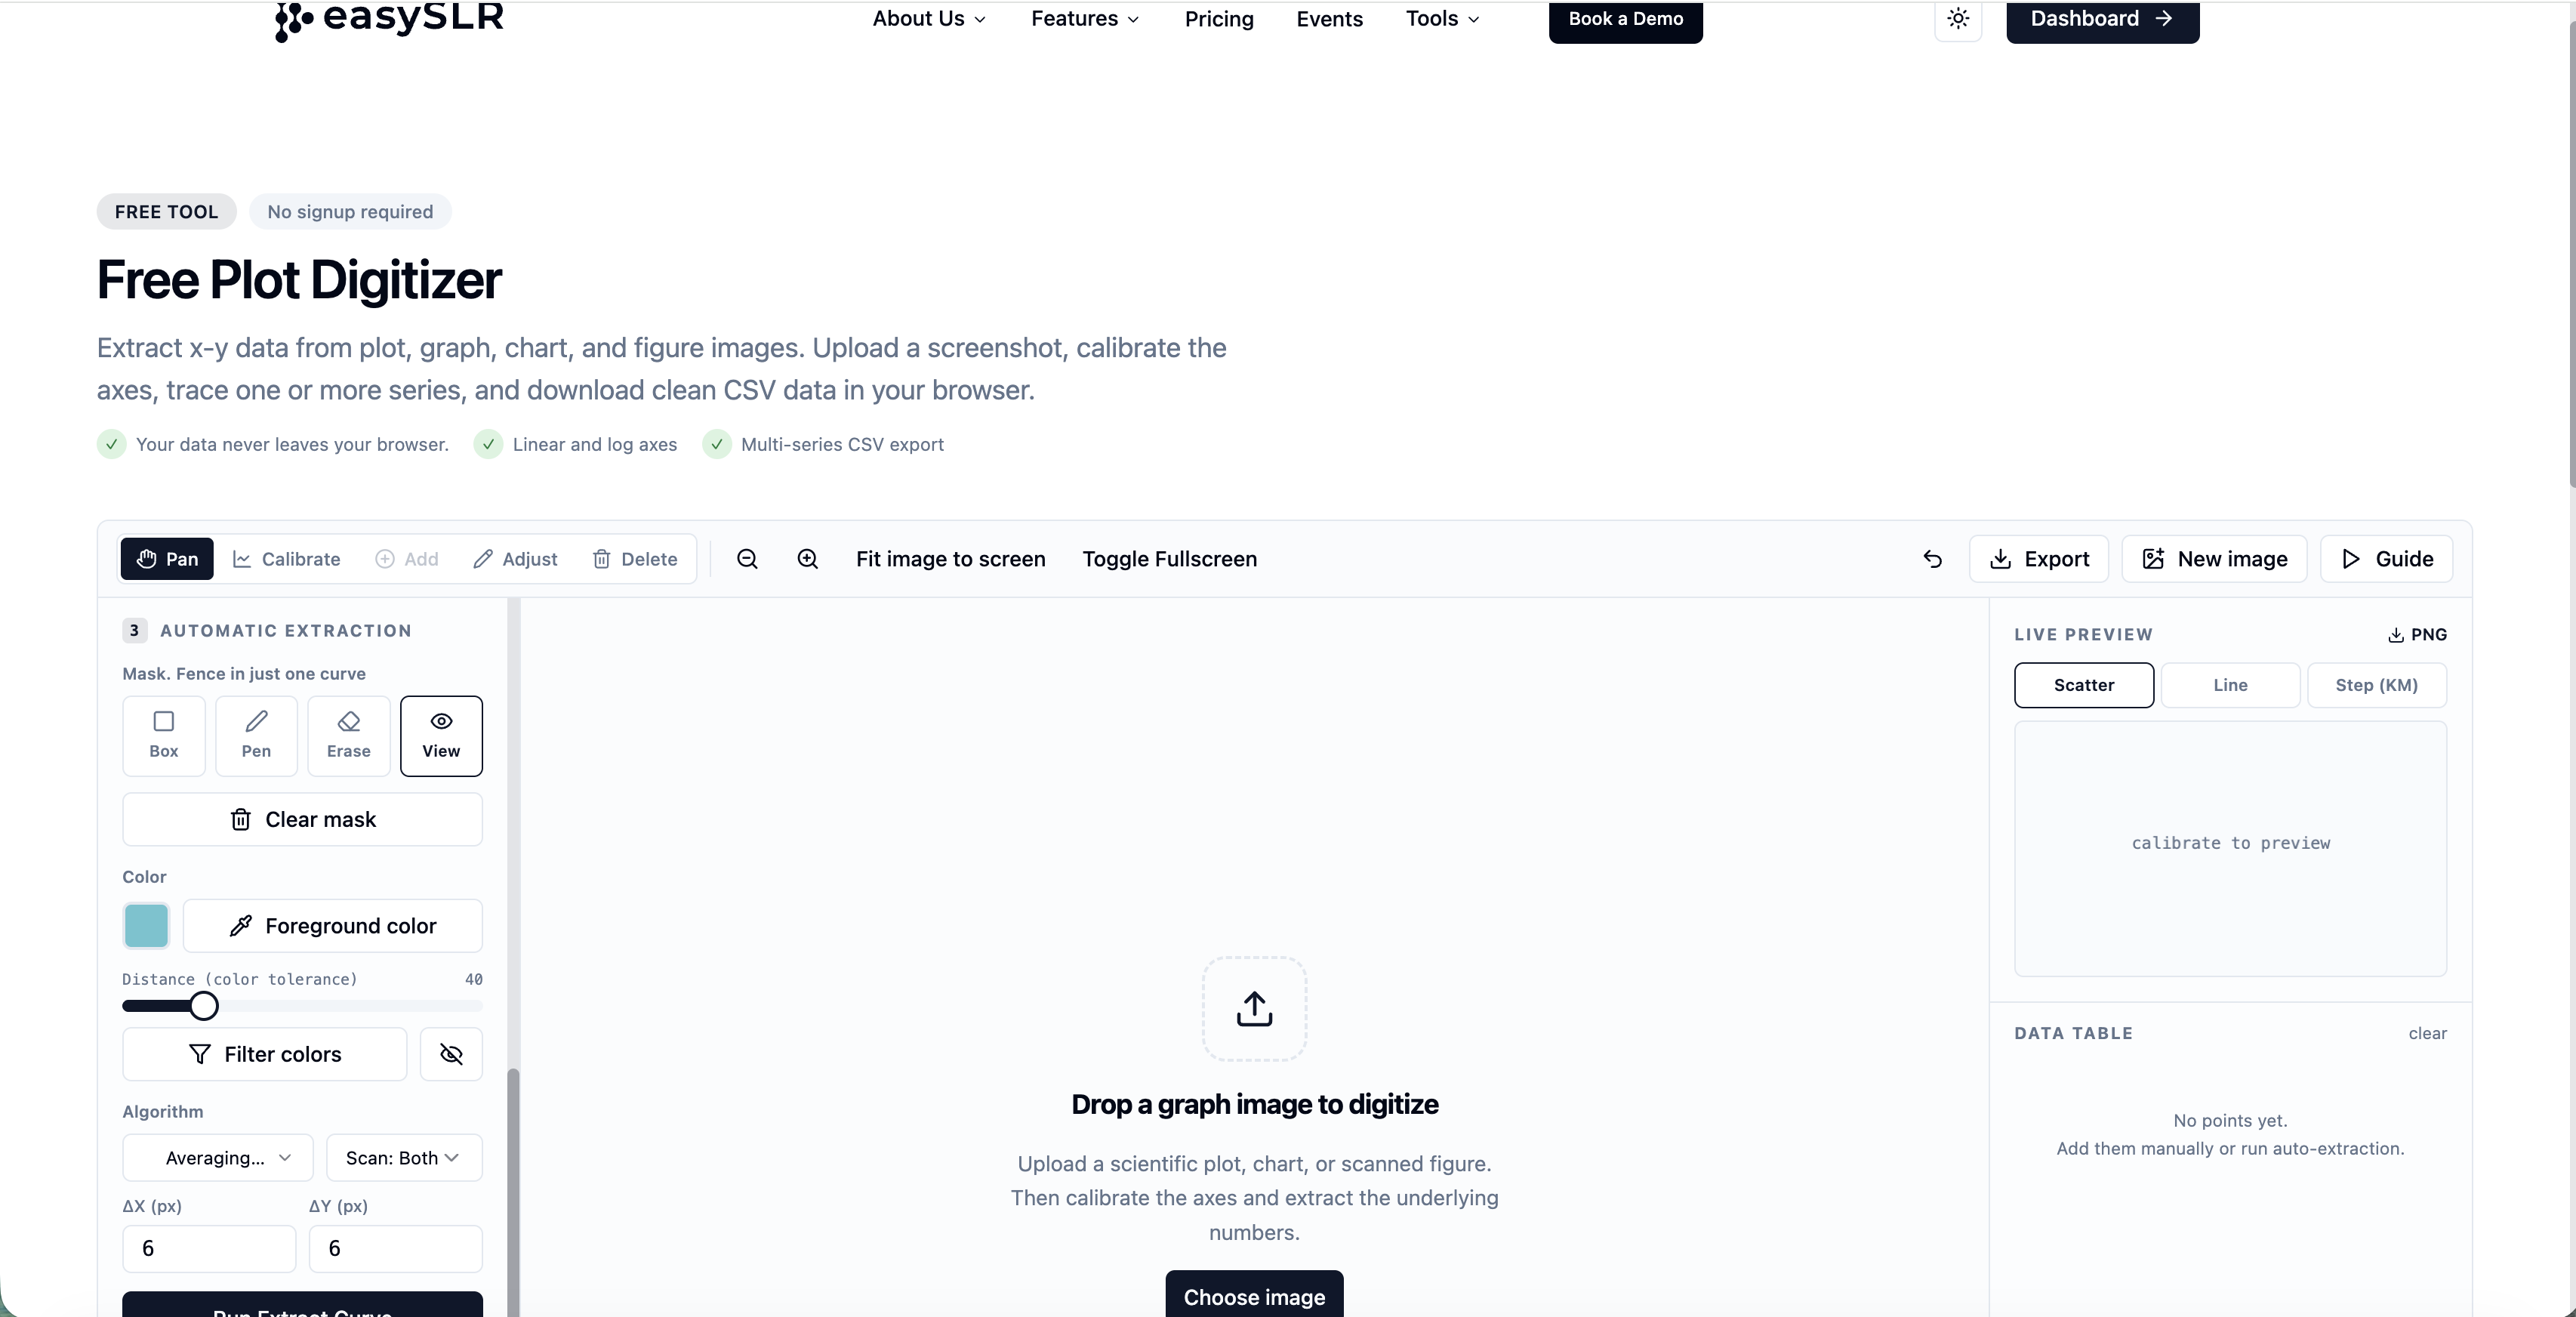
Upload the image of the figure.
Mark the Axis.
Add Datasets.
Click Run Extract Curve
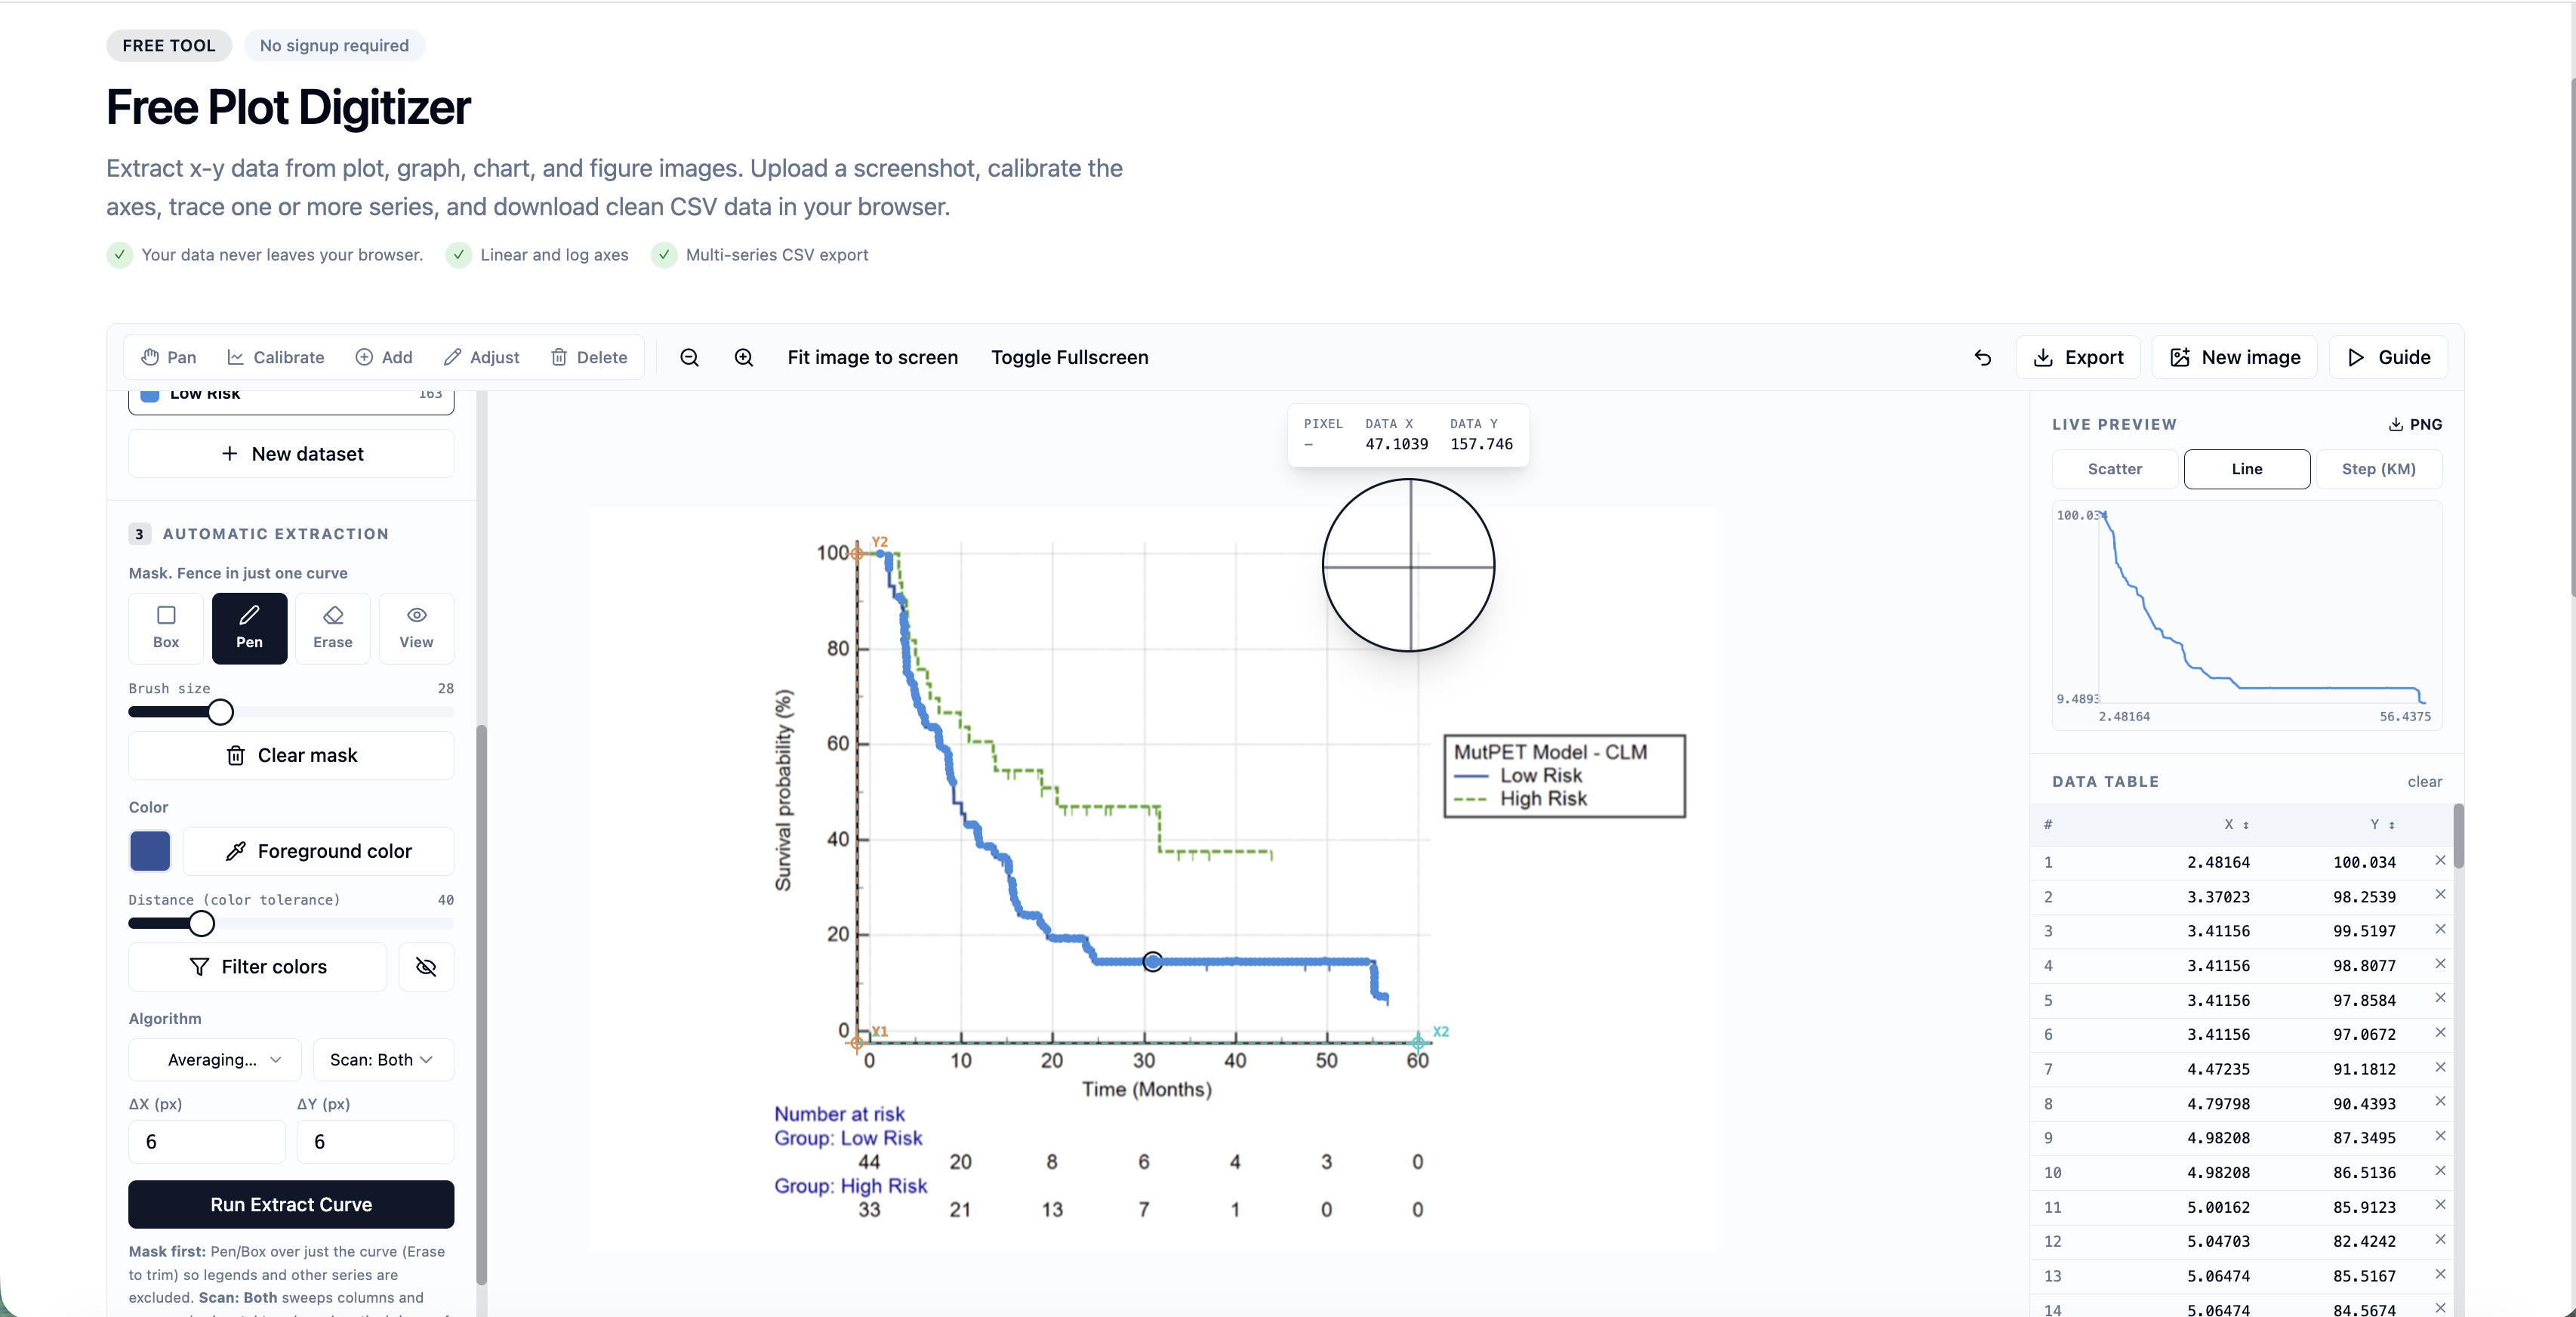
How the Plot Digitizer Works
The tool analyses the selected figure, extracts the underlying numerical data, and presents the results in a structured table for easy review. Users can verify the extracted values before using them in their analysis.
Reviewing the Extracted Data
Once processing is complete, EasySLR displays the extracted values in an easy-to-read tabular format.
Users can:
Review individual data points.
Verify extracted values against the original figure.
Compare multiple data series.
Confirm the accuracy before using the results.
Export Extracted Values
After reviewing the output, users can quickly export the extracted data.
Typical use cases include:
Data extraction forms
Excel worksheets
Statistical software
Meta-analysis preparation
Internal reports
Best Practices
For the best results:
Use clear, high-resolution PDF figures whenever possible.
Verify extracted values against the original graph before finalising data extraction.
Review multi-series graphs carefully to ensure the correct series has been identified.
Where appropriate, cross-reference extracted values with any supporting tables or text within the publication.
Common Use Cases
Researchers commonly use the Plot Digitizer to extract:
Survival curves
Clinical outcome measurements
Biomarker trends
Response rates over time
Treatment comparisons
Safety outcome graphs
Longitudinal study results
Frequently Asked Questions
Does the Plot Digitizer modify the original PDF?
No. The original publication remains unchanged. The extracted data can be separately exported in multiple formats.
Can I use the extracted values in my data extraction form?
Yes. The extracted values can be exported and incorporated into your project workflow after verification.
Should I review the extracted data?
Yes. While the Plot Digitizer greatly reduces manual effort, it is recommended that researchers validate the extracted values against the original figure before using them in analyses or reports.
Summary
The Plot Digitizer helps researchers convert graphical information from scientific publications into structured numerical data in just a few clicks. By reducing manual effort and improving the accessibility of figure-based results, it streamlines evidence extraction and supports faster, more efficient literature reviews while maintaining researcher oversight.